Dated market view
10-Year Treasury at 5%: New Normal and Threshold
10-year Treasury at 5% on Sept. 14, 2026: why it is a new normal and a threshold, in 7 charts on AI bonds, small-business loans, mortgages and the sell-off loop.
Cutoff and nature of this article
Written at 9:00 a.m. Pacific time on September 14, 2026 (16:00 UTC), using intraday values; the day’s closing figures may differ. The 10-year Treasury yield and every official release are the values in the linked sources. The words “new normal,” “threshold” and “loop” are the personal market view of the author, June Kim. Every chart is drawn from the cited figures and can be read as a table beneath it. Nothing here is a recommendation to buy or sell any stock or bond, and this article does not update itself.
Why did the 10-year Treasury yield reach 5%?
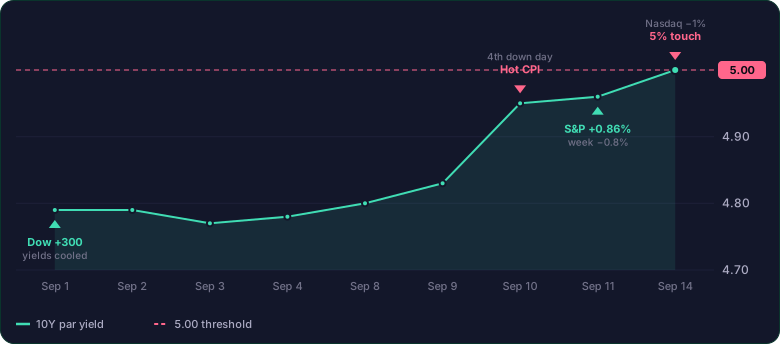
Hotter-than-expected August inflation, oil near $100 a barrel and a September FOMC hike priced at roughly 86–90% pushed the 10-year Treasury yield to 5.0% early on September 14, its first visit to that level since October 2023. By the Treasury’s daily par yield curve, the 10-year rose from 4.79% on September 1 to 4.83% on September 9, 4.95% on September 10 when August CPI was released, and 4.96% on September 11. Over the same span the 2-year moved from 4.39% to 4.63% and the 30-year from 5.27% to 5.35%. August CPI rose 0.4% for the month and 3.4% for the year, with core CPI up 0.3% for the month. CNN called the 5% level a critical threshold for the U.S. economy and markets the same day. U.S. Treasury: daily par yield curve rates, September 2026
Sources: BLS: August 2026 CPI, released September 11 · Yahoo Finance: stock market today, September 14, 2026 (10-year at 5%, AI remarks, hike odds) · Investrade: market review, September 11, 2026 (weekly moves, CPI, oil) · CNN Business: 10-year Treasury yield hits 5%, critical threshold for US economy and markets, September 14, 2026
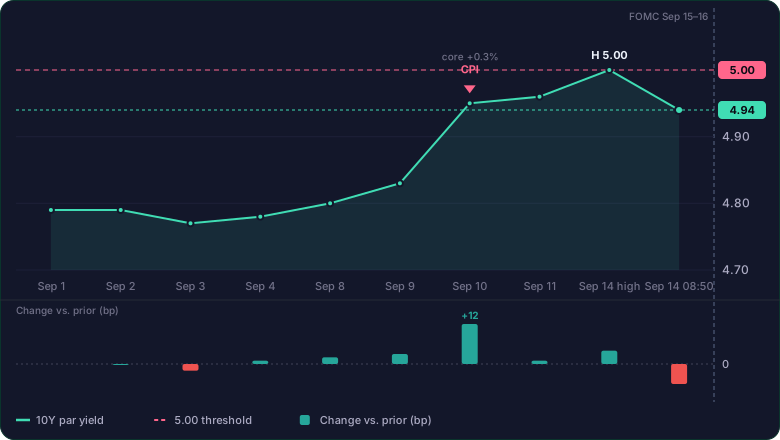
Read the chart as a table
| 10Y par yield (%) | Change vs. prior (bp) | |
|---|---|---|
| Sep 1 | 4.79 | — |
| Sep 2 | 4.79 | 0 |
| Sep 3 | 4.77 | -2 |
| Sep 4 | 4.78 | +1 |
| Sep 8 | 4.80 | +2 |
| Sep 9 | 4.83 | +3 |
| Sep 10 | 4.95 | +12 |
| Sep 11 | 4.96 | +1 |
| Sep 14 high | 5.00 | +4 |
| Sep 14 08:50 | 4.94 | -6 |
The dashboard through September 14: inflation, oil, policy, mortgages
Six official figures frame the week: August CPI, core CPI, oil, the FOMC hike probability, the federal funds target range and the 30-year mortgage rate. The table shows each value as of its release date; later revisions can supersede them. Between September 1 and 11 the whole yield curve shifted up, and the front end (2 to 5 years) rose the most. The gap between the 2-year and the 10-year (2s10s) narrowed from 40 to 33 basis points, meaning the market priced this week’s hike into the front end first. U.S. Treasury: daily par yield curve rates, September 2026
Sources: BLS: August 2026 CPI, released September 11 · Investrade: market review, September 11, 2026 (weekly moves, CPI, oil) · Freddie Mac: Primary Mortgage Market Survey, September 10, 2026 · Federal Reserve: FOMC calendar and releases
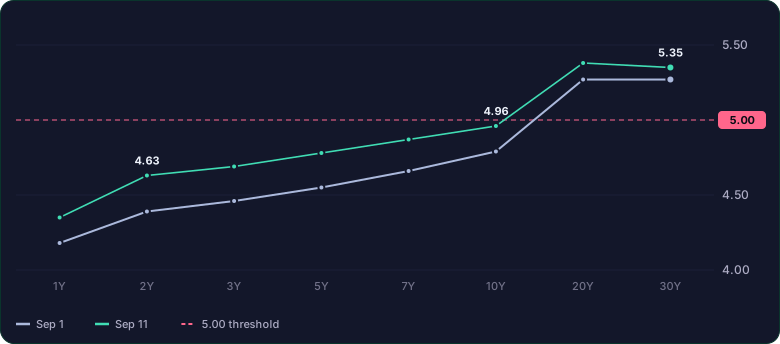
Read the chart as a table
| Sep 1 (%) | Sep 11 (%) | |
|---|---|---|
| 1Y | 4.18 | 4.35 |
| 2Y | 4.39 | 4.63 |
| 3Y | 4.46 | 4.69 |
| 5Y | 4.55 | 4.78 |
| 7Y | 4.66 | 4.87 |
| 10Y | 4.79 | 4.96 |
| 20Y | 5.27 | 5.38 |
| 30Y | 5.27 | 5.35 |
On narrow screens, scroll the table sideways. Keyboard users can focus the table and use the arrow keys.
| Indicator | Value | Note |
|---|---|---|
| August CPI Official source | +0.4% m/m · +3.4% y/y | Core CPI +0.3% m/m vs. 0.2% expected |
| WTI crude (Sept 11) Official source | $100.05 | About +8% on the week; Iran war, Strait of Hormuz |
| Sept 15–16 FOMC hike probability Official source | About 86–90% | Rose after CPI; futures-implied |
| Federal funds target range Official source | 3.50–3.75% | Held on July 29 (9–3 vote, three dissents for a hike) |
| 30-year fixed mortgage (Sept 10) Official source | 6.76% | Prior week 6.71%, a year ago 6.35% |
| 2s10s spread Official source | 33 bp (Sept 11) | Narrowed from 40 bp on Sept 1 |
Why 5% may be the new normal: a personal reading
My reading: if inflation stays in the 3% range and the supply factors persist, a 10-year between 4.5% and 5% becomes the center of this cycle rather than its ceiling. That is what “new normal” means here; it is a description of the assumptions embedded in today’s prices, not a forecast. Three reasons. The policy rate sits at 3.50–3.75% and markets have priced a hike this week. After the July hold, the 30-year climbed to its highest level since 2007, and doubt about the Fed’s resolve on inflation has attached a premium to long-term yields. On top of that sit an energy shock with oil in the $100s and the heavy supply of AI-related bonds discussed below. Chase: September rate hike now expected amid energy shocks, August 5, 2026
Sources: Federal Reserve: FOMC calendar and releases
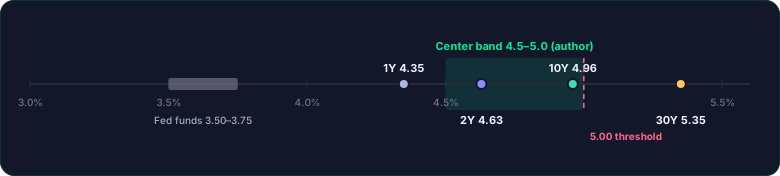
Read the chart as a table
| value | |
|---|---|
| Fed funds 3.50–3.75 | 3.50–3.75% |
| 1Y 4.35 | 4.35% |
| 2Y 4.63 | 4.63% |
| 10Y 4.96 | 4.96% |
| 30Y 5.35 | 5.35% |
| Center band 4.5–5.0 (author) | 4.50–5.00% |
| 5.00 threshold | 5.00% |
Big-tech AI bonds: spreads stacked on top of 5%
The first channel is big tech funding AI capital spending with bonds. Amazon, Alphabet, Meta and Oracle issued about $194 billion of bonds through July 7, 2026, up 79% from $108 billion in all of 2025. As supply grew, median spreads widened from 30 to 40 basis points on 2–4-year bonds, from 50 to 60 on 5–7-year bonds and from 108.5 to 118 on bonds beyond 20 years, and 78 of the 91 bonds issued in 2026 traded at higher yields than at issuance (median +22 bp). Cover ratios fell from nearly 5x in February to below 2x in July. My interpretation: add a widening spread to a 5% risk-free rate and the cost of funding AI capital spending becomes a valuation variable in its own right. Continuing to issue into cooling demand pushes existing bond prices lower. Reuters via Yahoo Finance: hyperscaler debt binge pushes yields up as investor demand cools, July 29, 2026
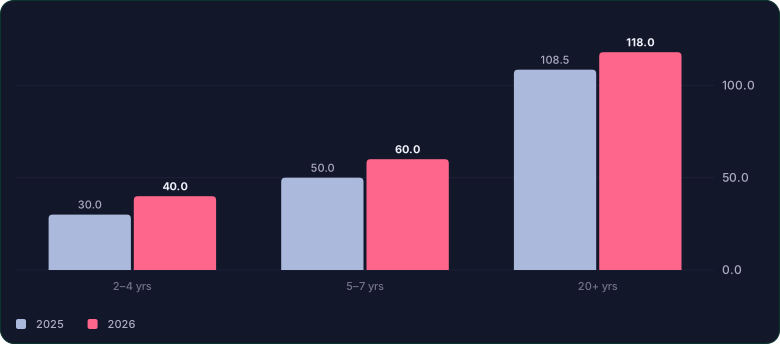
Read the chart as a table
| 2025 (bp) | 2026 (bp) | |
|---|---|---|
| 2–4 yrs | 30.0 | 40.0 |
| 5–7 yrs | 50.0 | 60.0 |
| 20+ yrs | 108.5 | 118.0 |
Small-business loans: a policy hike lands straight in interest expense
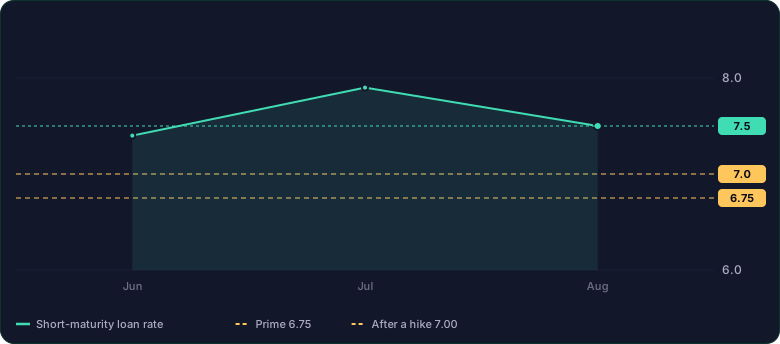
The second channel is small businesses that borrow short-term at floating rates. In NFIB’s August survey the average rate paid on short-maturity loans was 7.5%, down 0.4 points from July, while a net 4% of owners paid a higher rate on their most recent loan and the optimism index stood at 98.7. Much of this borrowing is tied to the prime rate. By convention prime sits 3 percentage points above the top of the federal funds target range, so it is 6.75% today and would become 7.00% after a 25-basis-point hike this week. My interpretation: because a policy hike passes almost directly into interest expense, hiring and investment decisions are cut first when sales soften at the same time. NFIB: Small Business Economic Trends, August 2026 report (PDF)
Sources: Federal Reserve: FOMC calendar and releases
Read the chart as a table
| Short-maturity loan rate (%) | |
|---|---|
| Jun | 7.4 |
| Jul | 7.9 |
| Aug | 7.5 |
Mortgages: a 5% 10-year means 30-year rates in the 7% range
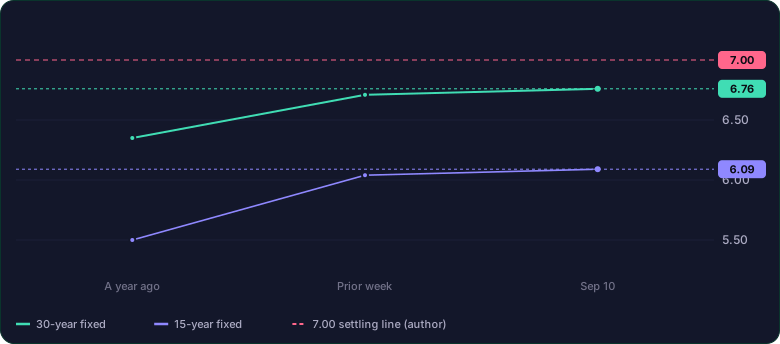
The third channel is mortgages, which track the 10-year. In Freddie Mac’s September 10 survey the 30-year fixed rate averaged 6.76%, above 6.71% the prior week and 6.35% a year earlier, and the 15-year fixed averaged 6.09%. Daily indexes were reported above 7% the same day. My interpretation: because mortgage rates follow the 10-year, a 10-year that holds at 5% settles 30-year fixed rates in the 7% range and weighs on home sales and household spending capacity. Freddie Mac: Primary Mortgage Market Survey, September 10, 2026
Sources: Yahoo Finance: mortgage rates just crossed 7%, September 10, 2026
Read the chart as a table
| 30-year fixed (%) | 15-year fixed (%) | |
|---|---|---|
| A year ago | 6.35 | 5.50 |
| Prior week | 6.71 | 6.04 |
| Sep 10 | 6.76 | 6.09 |
The loop: a sell-off lowers yields, a rebound revives inflation worry
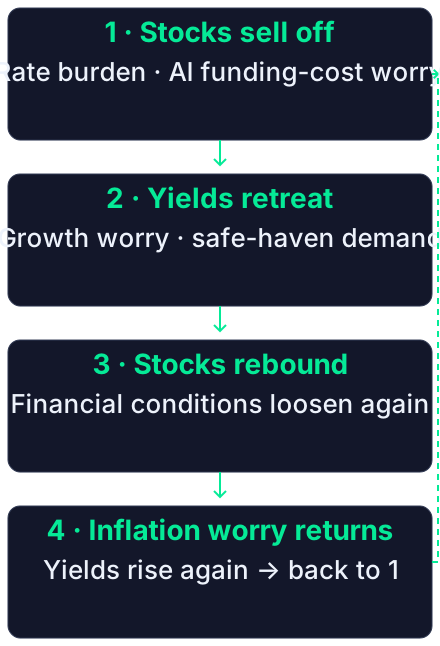
Stocks and yields have been feeding back into each other all month. On September 1 the Dow rose about 300 points after a three-day slide as yields cooled. From September 8 to 10, CPI and PPI came in above expectations, yields jumped and the S&P 500 and Nasdaq fell four sessions in a row. On September 11 the S&P 500 rebounded 0.86% and the Nasdaq 0.96%, yet both closed the week lower, by 0.8% and 0.7%. Early on September 14, as the 10-year printed 5%, the Nasdaq slipped about 1% again, led by semiconductors. The structure I see: when stocks fall hard enough, growth worry and safe-haven demand weaken the case for higher yields and yields come down. That decline invites a rebound; the rebound loosens financial conditions again, and inflation worry and higher yields return. CNBC: stock market news, September 1, 2026 (Dow rebounds as yields cool)
Sources: Investrade: market review, September 11, 2026 (weekly moves, CPI, oil) · Yahoo Finance: stock market today, September 14, 2026 (10-year at 5%, AI remarks, hike odds)
Read the chart as a table
| 10Y par yield (%) | |
|---|---|
| Sep 1 | 4.79 |
| Sep 2 | 4.79 |
| Sep 3 | 4.77 |
| Sep 4 | 4.78 |
| Sep 8 | 4.80 |
| Sep 9 | 4.83 |
| Sep 10 | 4.95 |
| Sep 11 | 4.96 |
| Sep 14 | 5.00 |
Read the diagram as text
- 1 · Stocks sell off: Rate burden · AI funding-cost worry
- 2 · Yields retreat: Growth worry · safe-haven demand
- 3 · Stocks rebound: Financial conditions loosen again
- 4 · Inflation worry returns: Yields rise again → back to 1
The morning of September 14: the market still wants to hold on to hope
Just before 8:50 a.m. Pacific time on September 14, President Trump said in an interview, in effect, that the war with Iran could be stopped, and by my observation the 10-year slipped from 5.0% to 4.94%. Six basis points on one remark. On September 13 in Doonbeg, Ireland, he had said the war would end “right after the midterms, maybe before,” and that Iran keeps calling to negotiate. With the oil channel driving inflation expectations, the prospect of an end to the war lowers long-term yields directly. The same morning, semiconductor stocks fell after leading AI companies called for pacing AI development, so equities are digesting two narratives at once. My interpretation: the market treats 5% as a threshold and is looking for reasons not to cross it. This intraday observation may differ from the close. Seoul Economic Daily: Trump says Iran keeps calling for talks, war to end soon, September 14, 2026
Sources: Yahoo Finance: stock market today, September 14, 2026 (10-year at 5%, AI remarks, hike odds)
What would break the loop: conditions by horizon
Three conditions would break the loop: lower oil reaching headline inflation, the Fed signaling the end of hikes, and a slower pace of bond supply. If only growth data soften while inflation stays, the loop tightens instead. The table lists what to watch on each horizon. Federal Reserve: FOMC calendar and releases
On narrow screens, scroll the table sideways. Keyboard users can focus the table and use the arrow keys.
| Horizon | What to watch | What breaks the loop |
|---|---|---|
| Short term · this week Official source | The Sept 15–16 FOMC decision and statement, oil, Iran negotiation headlines. One hike and a pause versus a door left open moves the 2-year first | A signal that hikes are over |
| Medium term · 1–3 months | Whether mortgage rates settle in the 7% range, the NFIB loan rate, cover ratios and spreads on AI bonds. If all three worsen together, 5% becomes a trigger for slower growth | A slower pace of bond supply |
| Long term · 1 year | Whether inflation comes down from the 3% range. If only growth softens while inflation stays, the loop tightens | Lower oil reaching headline inflation |
Questions to bring back to stock research
In GSDAQ I attach four questions to each company. First, how much debt matures within two years and how much higher the refinancing rate will be. Second, whether capital spending is funded from cash flow or bonds, and for AI spending, whether issuance can continue in a market where cover ratios are falling. Third, whether customers are directly exposed to rates, such as home buyers, car buyers or small businesses. Fourth, how sensitive the valuation is to a half-point change in the discount rate. These are checklist items to keep next to earnings dates and original filings, not trading signals. If the view changes after the FOMC meeting, a new dated article will record it.
Frequently asked questions
Short answers, using this article’s figures, to the questions searchers ask alongside this one. Answers are as of the September 14 intraday cutoff; anything marked ‘author’s view’ is neither a forecast nor a recommendation.
On narrow screens, scroll the table sideways. Keyboard users can focus the table and use the arrow keys.
| Question | Short answer |
|---|---|
| Why does a 5% 10-year yield matter for stocks? Official source | A higher discount rate compresses valuations and a risk-free 5% competes with equities. Big tech funding AI capex with bonds and sectors exposed to consumer rates react first (author’s view). |
| How do 10-year yields relate to mortgage rates? Official source | 30-year fixed mortgage rates track the 10-year. The 30-year averaged 6.76% on Sept 10; a 10-year held at 5% makes a 7% range more likely (author’s view). |
| What is the probability of a September Fed hike? Official source | About 86–90% for the Sept 15–16 meeting, as priced by futures on Sept 11. The actual decision is the Sept 16 statement. |
| Why did the 2-year rise more than the 10-year? Official source | The front end priced this week’s hike first: from Sept 1 to 11 the 2-year rose 24 bp and the 10-year 17 bp, narrowing 2s10s from 40 to 33 bp. |
Sources
- U.S. Treasury: daily par yield curve rates, September 2026
- BLS: August 2026 CPI, released September 11
- Yahoo Finance: stock market today, September 14, 2026 (10-year at 5%, AI remarks, hike odds)
- Investrade: market review, September 11, 2026 (weekly moves, CPI, oil)
- Freddie Mac: Primary Mortgage Market Survey, September 10, 2026
- Reuters via Yahoo Finance: hyperscaler debt binge pushes yields up as investor demand cools, July 29, 2026
- NFIB: Small Business Economic Trends, August 2026 report (PDF)
- Federal Reserve: FOMC calendar and releases
- CNBC: stock market news, September 1, 2026 (Dow rebounds as yields cool)
- Seoul Economic Daily: Trump says Iran keeps calling for talks, war to end soon, September 14, 2026
- Chase: September rate hike now expected amid energy shocks, August 5, 2026
- CNN Business: 10-year Treasury yield hits 5%, critical threshold for US economy and markets, September 14, 2026
- Yahoo Finance: mortgage rates just crossed 7%, September 10, 2026