The information cutoff for this review
Information cutoff: September 19, 2026 at 00:00 UTC. Index and ETF levels are daily closes from Yahoo Finance's historical tables, yields are the Treasury's daily par yield curve, oil is the front-month WTI futures settlement, and policy facts come from the Federal Reserve's own releases, all linked below. We did not measure analyst consensus, fund flows or intraday moves, so nothing here is labeled a surprise or the cause of a specific move. This is a dated article, not a live ticker, and it will not update itself.
The week in four numbers
From the prior Friday close to Friday's close, the S&P 500 fell 0.1% to 7,650.50, the Dow fell 1.7% to 51,682.64, the Nasdaq Composite rose 0.7% to 26,522.54 and the Russell 2000 fell 1.5% to 2,860.40. The 10-year Treasury par yield closed at 5.01%. GSDAQ's interpretation: three indexes moving in three directions in one week is a statement about composition, not about the market as a whole. Large-cap growth held; rate-sensitive and smaller companies did not. Yahoo Finance: S&P 500 (^GSPC) historical closes
Sources: Yahoo Finance: Dow Jones Industrial Average (^DJI) historical closes · Yahoo Finance: Nasdaq Composite (^IXIC) historical closes · Yahoo Finance: Russell 2000 (^RUT) historical closes · U.S. Treasury: daily par yield curve rates, 2026
September 16: the FOMC raised the target range
The Committee raised the target range for the federal funds rate by a quarter point to 3.75–4.00%, by a 12–0 vote, and wrote that inflation remains elevated and that the action will support a timelier return to the 2 percent goal. It is the first increase since July 26, 2023. The Summary of Economic Projections shows a median federal funds rate of 4.1% at the end of 2026 and 2027 and 3.9% at the end of 2028; sixteen of eighteen participants placed the 2026 year-end rate above the new range. GSDAQ's interpretation: read the range as a description of overnight policy and the projections as a distribution of views, not a promise. Neither is a company's borrowing cost. Federal Reserve: FOMC statement, September 16, 2026
Sources: Federal Reserve: Summary of Economic Projections, September 16, 2026 · Federal Reserve: open market operations — target range history
Yields and oil: the two prices behind the decision
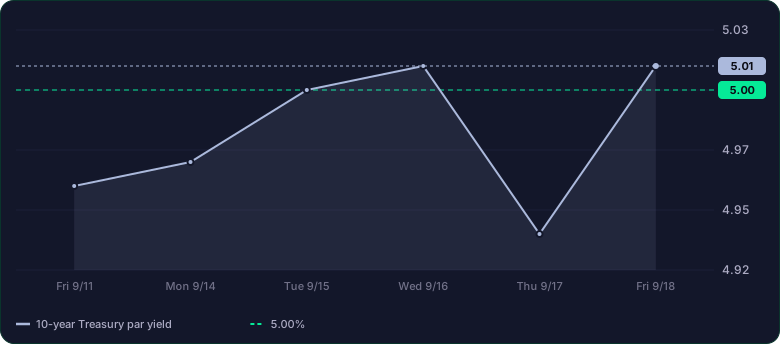
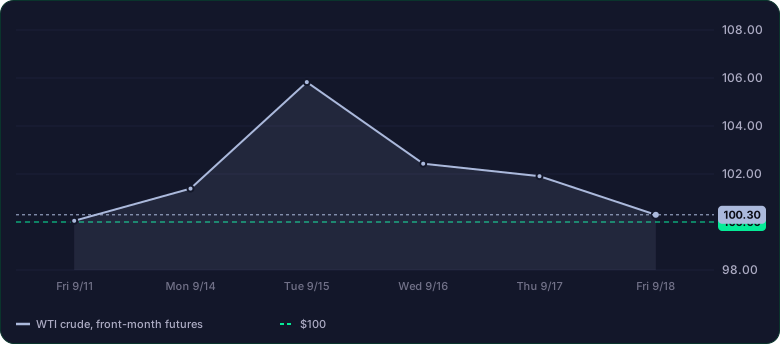
The 10-year par yield moved from 4.96% on September 11 to 5.00% on Tuesday and 5.01% on Wednesday, fell to 4.94% on Thursday and closed the week at 5.01%; the 2-year rose from 4.63% to 4.76%. Front-month WTI settled at $100.05 on September 11, peaked at $105.83 on Tuesday and finished the week at $100.30, above $100 on every session. GSDAQ's interpretation: with long yields above 5% and oil above $100, financing costs and input costs are both open questions for earnings, which is why the sector table below is worth more than the index headline. U.S. Treasury: daily par yield curve rates, 2026
Sources: Yahoo Finance: WTI crude front-month futures (CL=F) historical closes
Sector rotation: what held and what did not
Measured with the eleven Select Sector SPDR ETFs, prior Friday close to Friday close, only two groups rose: health care +1.8% and technology +1.0%. Consumer staples −0.7%, energy −1.3%, industrials −1.5%, communication services −1.6%, consumer discretionary −1.7% and materials −1.9% fell moderately; real estate −2.0%, financials −2.4% and utilities −3.0% fell most. These are ETF price returns, not the S&P sector indexes and not total returns. GSDAQ's interpretation: the groups whose valuations lean on financing costs and dividend yields gave back the most in the week the policy rate rose; that is a reason to check a holding's sector before reading its move. Yahoo Finance: Technology Select Sector SPDR (XLK) historical closes — the other ten sector ETFs use the same page pattern
Day by day: how the week traded
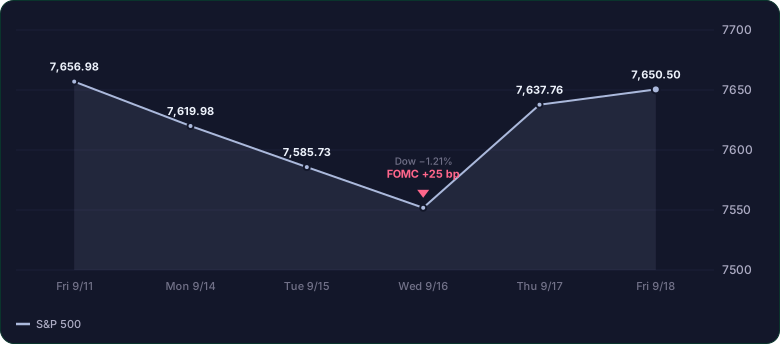
Monday the S&P 500 fell 0.48% to 7,619.98 with oil above $100 into the meeting; Tuesday it lost another 0.45% to 7,585.73 as WTI peaked; Wednesday it closed 0.45% lower at 7,551.81 after the 14:00 ET decision, with the Dow down 1.21% to 51,461.90; Thursday, when oil and yields both fell, it rebounded 1.14% to 7,637.76; Friday, the quarterly options and futures expiration, it added 0.17% to 7,650.50. GSDAQ's interpretation: the low of the week was printed on the decision. Thursday's rebound coincided with lower oil and yields; these closes show the co-movement, not what drove it. Yahoo Finance: S&P 500 (^GSPC) historical closes
Sources: Yahoo Finance: Dow Jones Industrial Average (^DJI) historical closes · Yahoo Finance: WTI crude front-month futures (CL=F) historical closes · U.S. Treasury: daily par yield curve rates, 2026
What to bring back to stock research
GSDAQ's interpretation is a set of questions to carry into each holding: can the company absorb higher financing costs or pass them on, is demand holding with oil above $100, and how sensitive is its valuation to a 10-year yield above 5%? In the app, a price-move, keyword or agent-card alert is a rule that fires when a stated condition is met; it is not a forecast and not a recommendation. None of the figures above establish a buy or sell signal, a recession call or a promised return.
What is on the calendar next
The Federal Reserve's calendar lists October 27–28, 2026 as the next FOMC meeting. Check the statement and projections when they are released; this article describes the week ending September 18 and will not be revised to cover later events. Material corrections, if any, will carry a visible note and an updated date. Federal Reserve: FOMC meeting calendar
Sources
- Federal Reserve: FOMC statement, September 16, 2026
- Federal Reserve: Summary of Economic Projections, September 16, 2026
- Federal Reserve: open market operations — target range history
- U.S. Treasury: daily par yield curve rates, 2026
- Yahoo Finance: S&P 500 (^GSPC) historical closes
- Yahoo Finance: Dow Jones Industrial Average (^DJI) historical closes
- Yahoo Finance: Nasdaq Composite (^IXIC) historical closes
- Yahoo Finance: Russell 2000 (^RUT) historical closes
- Yahoo Finance: WTI crude front-month futures (CL=F) historical closes
- Yahoo Finance: Technology Select Sector SPDR (XLK) historical closes — the other ten sector ETFs use the same page pattern
- State Street: the Select Sector SPDR ETFs
- Federal Reserve: FOMC meeting calendar