
The October 9 close in brief
All four major U.S. indexes rose in the October 9 regular session. In the University of Michigan's preliminary October consumer sentiment survey, released the same day, the notable change was less the decline in the overall index than its composition. Compared with the September final reading, the Current Economic Conditions index fell 6.2 points, while the Index of Consumer Expectations rose 1.0 point. Year-ahead and long-run inflation expectations each rose 0.1 percentage point. However, this data alone cannot establish a cause-and-effect link between the sentiment results and the rise in stocks. Timing · Information as of: 4:00 p.m. PDT on Oct. 9 (7:00 p.m. EDT) · Stock closes: Oct. 9 regular-session close at 4:00 p.m. EDT (1:00 p.m. PDT) · After-hours prices are not included.
The split between current conditions and expectations was larger than the move in the overall index
The table below shows the preliminary October results posted on the University of Michigan's official website (University of Michigan Surveys of Consumers). The changes were calculated by GSDAQ through simple subtraction and do not reflect any assessment of statistical significance. The top three rows are in index points; the bottom two are in percent and percentage points. The two units are not compared with each other. Year-ahead expectations ask about the rate of price increases over the next 12 months, and long-run expectations ask about the average annual rate over the next 5 to 10 years (Survey questionnaire). The Index of Consumer Expectations measures views on the outlook for the economy and household finances. It is a different measure from inflation expectations. That is why, as this month, the expectations index can rise while inflation expectations also rise. Summarizing this release as "expectations worsened across the board" would be wrong. The University of Michigan said buying conditions for durable goods deteriorated sharply amid high prices and borrowing costs, while expectations for personal finances and the economy improved slightly (University of Michigan Surveys of Consumers). This is the University of Michigan's interpretation. It is not data showing that actual consumer spending declined.
Sources: sca.isr.umich.edu · University of Michigan Surveys of Consumers · data.sca.isr.umich.edu · Survey questionnaire
On narrow screens, scroll the table sideways. Keyboard users can focus the table and use the arrow keys.
| Item | September final | October preliminary | Change |
|---|---|---|---|
| Index of Consumer Sentiment Source | 48.1 | 46.3 | −1.8 pts |
| Current Economic Conditions Source | 50.9 | 44.7 | −6.2 pts |
| Index of Consumer Expectations Source | 46.3 | 47.3 | +1.0 pt |
| Year-ahead inflation expectations Source | 4.6% | 4.7% | +0.1 percentage point |
| Long-run (5–10 year) inflation expectations Source | 3.4% | 3.5% | +0.1 percentage point |
All four major indexes rose in a normal session
The values in the table are index levels, not ETF prices. The fact that all four indexes rose does not mean that most stocks rose. In the Treasury's daily rates, the 10-year yield rose 2bp, from 5.22% on October 8 to 5.24% on October 9 (U.S. Treasury). These values are based on bid-side indicative quotations collected by the Federal Reserve Bank of New York at or near 3:30 p.m. EDT (12:30 p.m. PDT) and converted to constant maturity Treasury (CMT) yields. They are not taken at the same time as the 4:00 p.m. EDT stock close or the market reaction immediately after the release. The previous day's mixed index moves and decline in yields are covered in the October 8 market-close brief. The NYSE operated on its normal 9:30 a.m.–4:00 p.m. EDT trading hours that day, with no early close (NYSE trading hours). The table below shows regular-session closes and rounded percentage changes as tallied by AP (AP).
Sources: NYSE trading hours information · AP · U.S. Department of the Treasury · U.S. Treasury
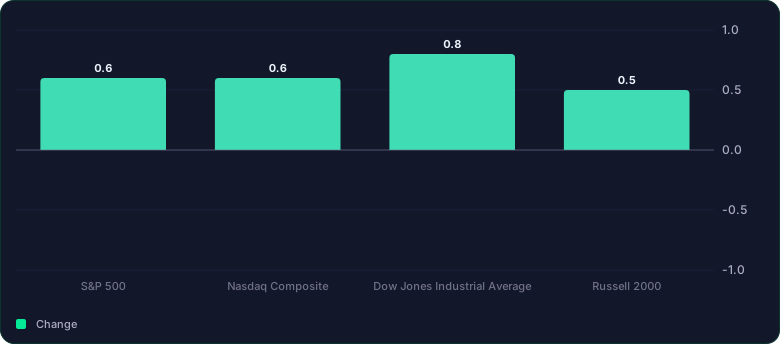
Read the chart as a table
| Change (%) | |
|---|---|
| S&P 500 | 0.6 |
| Nasdaq Composite | 0.6 |
| Dow Jones Industrial Average | 0.8 |
| Russell 2000 | 0.5 |
On narrow screens, scroll the table sideways. Keyboard users can focus the table and use the arrow keys.
Checking this morning's conditions against the actual results
On the morning of the same day, GSDAQ set conditions for what it would watch in this release. The table below checks those conditions against the results as of the close. The assessments are GSDAQ's interpretation. The first three rows, which compare released figures, were confirmed against the official release. Judgment on the actual survey period and the market reaction around the release is deferred because the data is not available.
Sources: sca.isr.umich.edu · University of Michigan Surveys of Consumers
On narrow screens, scroll the table sideways. Keyboard users can focus the table and use the arrow keys.
| Condition set this morning | Result as of the close | Assessment |
|---|---|---|
| Direction of the overall index Source | Down | Confirmed |
| Direction of the current conditions and expectations indexes Source | Current conditions down, expectations up | Confirmed (divergent) |
| Year-ahead and long-run inflation expectations Source | Up for both horizons | Confirmed |
| Whether the scheduled survey period was the actual period Source | Actual period not found | Pending |
| Price comparison of the same instrument, measured the same way, just before and just after the release Source | Comparison data not obtained | Pending |
What could not be confirmed, and what comes next
Survey period. The schedule the University of Michigan published in advance called for the survey to begin September 22 and for the preliminary tabulation to close October 5 (Survey schedule). The actual start and end dates for this preliminary sample could not be found on the official website or in its list of published reports. The September 22–October 5 window is therefore used only as the scheduled period. This brief does not link oil or stock price movements in the days before the release to survey responses. Market reaction around the release. GSDAQ did not obtain prices for the same instrument, measured the same way, just before and just after the scheduled 10:00 a.m. EDT release. This brief therefore does not conclude that yields rose because of the sentiment results. Nor does it conclude that stocks rose on expectations of rate cuts or that the market ignored the results. The stock and yield figures in this brief are each daily results. Next on the calendar. The final October reading is scheduled for release on October 23 at 10:00 a.m. EDT (University of Michigan Surveys of Consumers). The final reading will show whether the split between current conditions and expectations, and the rise in inflation expectations for both horizons, still hold. This brief summarizes market data for information only and does not recommend any trade or individual security. It is a review draft prepared with the help of AI and checked by automated review. A final human review has not yet been conducted.
Sources: data.sca.isr.umich.edu · Survey schedule · sca.isr.umich.edu · University of Michigan Surveys of Consumers
About this brief
GSDAQ wrote and reviewed this brief from public sources with the help of AI tools. It is for information only and is not a recommendation to buy or sell any security or investment advice.