
October 9 premarket summary
The University of Michigan's preliminary October consumer sentiment reading is scheduled for release today at 10:00 a.m. EDT (7:00 a.m. PDT) (University of Michigan Surveys of Consumers). That is 30 minutes after the U.S. regular session opens and three hours after this brief's information cutoff. As of this writing, the preliminary October reading had not been released. The final October reading is scheduled for release on October 23 (official release calendar). When reading this preliminary figure, start with the period the survey covers. Under the official schedule, response collection for the preliminary reading closes on October 5. That is earlier than the overnight moves in oil and futures. The release is therefore compared with September's final figures. In that comparison, the overall sentiment index, the current-conditions and expectations components, and the one-year and long-run inflation expectations are read separately. This brief's information cutoff is 4:00 a.m. PDT (7:00 a.m. EDT) on October 9, 2026. Today's NYSE regular session runs from 9:30 a.m. to 4:00 p.m. EDT (6:30 a.m. to 1:00 p.m. PDT), and no early close is scheduled (NYSE trading hours).
Sources: sca.isr.umich.edu · University of Michigan Surveys of Consumers · data.sca.isr.umich.edu · Official release calendar · NYSE trading hours
The scheduled survey period for today's preliminary reading
According to the University of Michigan's official 2026 survey schedule, the October survey begins on September 22. Tabulation for the preliminary reading closes on October 5, and the full survey ends on October 19. If that schedule held, the preliminary reading released today is based on responses from September 22 through October 5. A release date of October 9 does not mean the reading captures consumer reactions to the October 8 stock decline or the overnight drop in oil prices. Nor can the reasoning "oil fell overnight, so inflation expectations must be lower today" be drawn. That period, however, is the scheduled one. Once the release is out, the first thing to check is the survey period stated in it for the preliminary reading. If the cutoff differs from October 5, the timing comparison in this brief should be revisited against that date.
Sources: data.sca.isr.umich.edu · 2026 official survey schedule
Benchmark: September final figures
The values below are September's final figures, not October forecasts. They come from the September final results on the University of Michigan home page and the inflation expectations time-series table. The three indexes in the table are not percentages. The sentiment index converts responses to five questions on household finances, business conditions and buying conditions for durable goods into a value based on 1966 (index calculation). So 48.1 is not read as "48.1% of respondents are pessimistic." Nor is 50 used as a dividing line between expansion and contraction, as with a PMI. The consumer expectations index of 46.3 is an index reflecting the outlook for business conditions and household finances; it is a different variable from long-run inflation expectations of 3.4%. The two inflation expectations lines are survey responses. The University of Michigan asks separate questions about the outlook for the next 12 months and the average annual outlook over the next 5 to 10 years (questionnaire Q13 and Q14). They are different data from actual CPI, PCE or consumer spending figures.
Sources: sca.isr.umich.edu · University of Michigan Surveys of Consumers · sca.isr.umich.edu · Inflation expectations time-series table · data.sca.isr.umich.edu · Index calculation · data.sca.isr.umich.edu · Questionnaire Q13 and Q14
On narrow screens, scroll the table sideways. Keyboard users can focus the table and use the arrow keys.
| Item | September final | Unit |
|---|---|---|
| Consumer sentiment index Source | 48.1 | Index (pts) |
| Current economic conditions index Source | 50.9 | Index (pts) |
| Consumer expectations index Source | 46.3 | Index (pts) |
| Inflation expectations, next year Source | 4.6 | % |
| Inflation expectations, long run (average annual, next 5 to 10 years) Source | 3.4 | % |
Overnight and the previous session
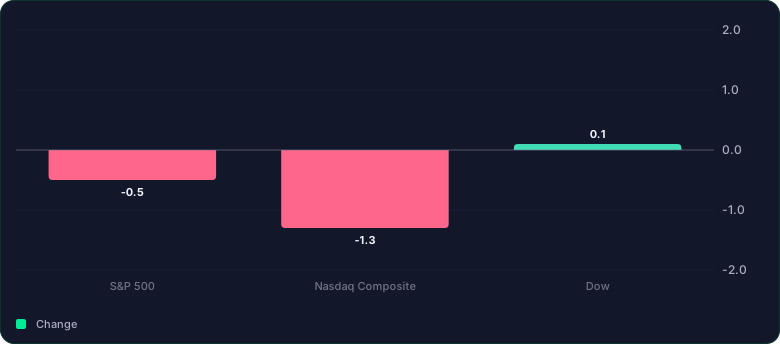
Reuters posted an article at 4:31 a.m. EDT on October 9 and updated it at 4:32 a.m. EDT (1:32 a.m. PDT). According to the article, European stocks opened higher, U.S. stock index futures pointed higher and Brent crude futures fell. It said U.S. Treasury yields fell on Thursday and then edged back up slightly (Reuters, via MarketScreener). The article's posting and update times are not the times individual quotes were observed. The article also does not give quote observation times or futures contract months. This brief therefore summarizes only the direction as of the article's timing. It is not used as precise pricing at the information cutoff or as a confirmed direction for cash indexes in the regular session. This direction is not attributed to any particular event, and it is not linked as a cause of today's survey results. Fed Governor Waller's personal views on the pace of rate changes are covered in the October 8 premarket brief. That brief was written as of 4:00 a.m. PDT on October 8. It does not include the claims or auction results released during that day's session. Based on closing prices at 4:00 p.m. EDT on October 8, the previous trading day, the Russell 2000 rose less than 0.1% to 2,794.13 points. The percentage changes are AP's rounded figures. All are index levels, not ETF prices. The closes and percentage changes for the S&P 500, Nasdaq Composite and Dow are shown in the table below.
Sources: Reuters, via MarketScreener · AP
Read the chart as a table
| Change (%) | |
|---|---|
| S&P 500 | -0.5 |
| Nasdaq Composite | -1.3 |
| Dow | 0.1 |
On narrow screens, scroll the table sideways. Keyboard users can focus the table and use the arrow keys.
What to check after the release
The following are GSDAQ's editorial reading criteria. They do not predict the release or recommend any investment, and they are not a confirmed Fed rate decision. 1. Check the components: See which direction the overall index moved from 48.1. Then separate whether that change came from the current economic conditions index (50.9 in September) or the consumer expectations index (46.3 in September). A rise in the overall index alone is not taken to mean that consumer spending has recovered across the board. 2. Separate price expectations: Compare one-year inflation expectations with September's 4.6% and long-run inflation expectations with September's 3.4%, each on its own. An improvement in sentiment and an easing of price pressures are separate questions. If only one of them improved, conclusions are limited to that scope. 3. Measure the market reaction: The reaction to the release is compared using prices for the same instrument and the same maturity at stated times just before and just after 10:00 a.m. EDT. Reports of overnight declines in oil alone are not used to explain the survey results or to set the intraday direction. This brief is a review draft written with the help of AI and has not undergone final human review.
About this brief
GSDAQ wrote and reviewed this brief from public sources with the help of AI tools. It is for information only and is not a recommendation to buy or sell any security or investment advice.
Sources
- sca.isr.umich.edu · University of Michigan Surveys of Consumers
- data.sca.isr.umich.edu · Official release calendar
- NYSE trading hours
- data.sca.isr.umich.edu · 2026 official survey schedule
- sca.isr.umich.edu · Inflation expectations time-series table
- data.sca.isr.umich.edu · Index calculation
- data.sca.isr.umich.edu · Questionnaire Q13 and Q14
- Reuters, via MarketScreener
- AP