
The October 8 close in brief
The major indexes moved in different directions in the October 8 U.S. regular session. The Nasdaq Composite and the S&P 500 fell, while the Dow and the Russell 2000 edged higher. Initial jobless claims released that day fell from the prior week once the revision to the previous week is taken into account. Continuing claims, which cover a period one week earlier, rose for the single week. When this morning's brief was written at 4:00 a.m. PDT, neither the jobless claims report nor the 30-year auction results had been released. Each section below sets the conditions this morning's brief said it would check alongside the actual results. > Timing: Stock prices are as of the October 8 regular-session close (4:00 p.m. EDT, 1:00 p.m. PDT). This brief reflects information as of 4:00 p.m. PDT on October 8 (7:00 p.m. EDT). It was a normal trading day with no early close (NYSE trading hours). After-hours prices are not included.
Sources: NYSE trading hours information
Index closes: Moving in different directions
Closing values are AP's final tallies; only the percentage changes are AP's rounded figures. The closes for the three major indexes in Reuters' market-close report are the same. Reuters reported that chip stocks were weak on the day. In the previous session, all four major indexes fell together.
Sources: AP final market close tally · finance.yahoo.com · Reuters market-close report
On narrow screens, scroll the table sideways. Keyboard users can focus the table and use the arrow keys.
197,000: Same number, different reference weeks
This morning's brief said it would check the reference week for initial claims, the revision to the prior week and the four-week average, and look separately at the trend in continuing claims, which cover a period one week earlier. Initial jobless claims were released at 8:30 a.m. EDT in the Labor Department's weekly report. All figures below are seasonally adjusted. The latest week's figures in this release are preliminary and may be revised in next week's report. The 197,000 figure cited in this morning's brief was the preliminary reading for the week ended September 26. The 197,000 figure released today is the preliminary reading for the week ended October 3. The numbers are the same, but they belong to different weeks, so reading them as unchanged from the prior week would be wrong. With the week ended September 26 revised up to 199,000, the latest week shows a decrease of 2,000. Initial claims and continuing claims have reference weeks one week apart. This brief does not read the two figures together as describing the labor market in the same week. Continuing claims rose by 17,000 for the single week, while their four-week average fell by 12,250. A single week's increase is not enough to conclude that continuing claims have entered an upward trend. This morning's brief set as its condition whether several indicators were slowing together. Initial claims fell, but continuing claims rose for the single week, so GSDAQ reads this condition as not having been met consistently. Governor Waller's assessment, in a morning speech, that the labor market is stable is his personal view. This one week of data neither confirms nor refutes that assessment, and this brief does not anticipate the Fed's decisions.
Sources: U.S. Department of Labor weekly unemployment insurance claims · Federal Reserve speech
On narrow screens, scroll the table sideways. Keyboard users can focus the table and use the arrow keys.
| Item | Reference week (this release) | This release (preliminary) | Prior week, revised | Change from prior week |
|---|---|---|---|---|
| Initial claims Source | Week ended Oct. 3 | 197,000 | 199,000 (week ended Sept. 26; revised up from 197,000) | -2,000 |
| Initial claims, 4-week average Source | Week ended Oct. 3 | 198,000 | 200,500 (revised from 200,000) | -2,500 |
| Continuing claims Source | Week ended Sept. 26 | 1,716,000 | 1,699,000 (week ended Sept. 19; revised down from 1,701,000) | +17,000 |
| Continuing claims, 4-week average Source | Week ended Sept. 26 | 1,711,000 | 1,723,250 (revised) | -12,250 |
30-year bond reopening auction results
This morning's brief said it would check the bid-to-cover ratio, the allotment breakdown and the high yield at the 30-year auction. Competitive bidding closed at 1:00 p.m. EDT, and the results were confirmed from the Treasury's official auction results. The bid-to-cover ratio is the amount bid divided by the amount accepted; both amounts exclude allotments to the Fed's SOMA. This time, $55,913,353,100 in bids divided by $22,000,012,700 accepted gives 2.54. It is not a ratio of the number of bidding institutions. The indirect bidders' share is the portion of $21,939,603,600 in competitive accepted amounts that went to indirect bidders, $15,866,059,500, as calculated by GSDAQ from the official data. The indirect bidder category cannot be assumed to be foreign central banks. This brief did not compare data on the same basis from past 30-year auctions. It therefore does not judge whether demand on the day was unusually strong or weak. Nor does it make a simple comparison with the previous day's 10-year auction.
Sources: U.S. Treasury auction results announcement
On narrow screens, scroll the table sideways. Keyboard users can focus the table and use the arrow keys.
| Item | Result |
|---|---|
| Security Source | 30-year bond reopening (original maturity 30 years, 29 years and 10 months remaining), CUSIP 912810UW6 |
| Offering amount Source | $22 billion |
| Auction date / Issue and settlement date Source | Oct. 8 / Oct. 15 |
| High yield Source | 5.618% |
| Bid-to-cover ratio Source | 2.54 |
| Indirect bidders' share of competitive accepted amounts Source | 72.3% |
2-, 10- and 30-year yields fell, and so did the Nasdaq
These are the Treasury's daily Treasury yield curve rates. They are calculated by the Treasury from quotes at or near 3:30 p.m. EDT. They are not actual transaction prices or closing values for individual securities, and they are taken at a different time from the 4:00 p.m. stock close. Changes are differences from the prior day in the same series; 1bp equals 0.01 percentage point. The auction high yield of 5.618% and the daily 30-year rate of 5.60% refer to different securities and are calculated on different bases. The difference between the two is not interpreted as a change in yields after the auction. The 2-, 10- and 30-year yields shown in the table were lower than the prior day, yet the Nasdaq and the S&P 500 fell while the Dow and the Russell 2000 edged higher. The day's trading is hard to explain with a single story that lower yields lift stocks. This brief does not attribute the decline in yields and the mixed direction of the indexes to any one of the auction, the jobless claims report or Governor Waller's remarks. The data obtained for this brief could not confirm such a causal link. This brief summarizes market results and public data and does not recommend any specific security or trade. This brief is a review draft prepared with the help of AI; a final human review has not been conducted.
Sources: U.S. Treasury · Daily Treasury yield curve rates
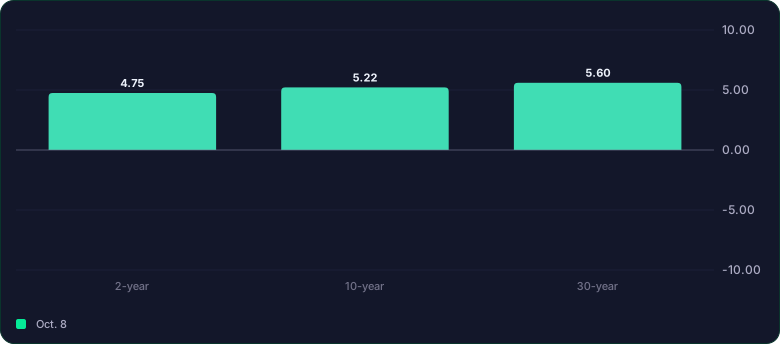
Read the chart as a table
| Oct. 8 (%) | |
|---|---|
| 2-year | 4.75 |
| 10-year | 5.22 |
| 30-year | 5.60 |
On narrow screens, scroll the table sideways. Keyboard users can focus the table and use the arrow keys.
About this brief
GSDAQ wrote and reviewed this brief from public sources with the help of AI tools. It is for information only and is not a recommendation to buy or sell any security or investment advice.