Stock discovery & returns
Growth-stock screeners and strategy return claims
A research process for discovering market leaders using growth, price strength and liquidity, then checking whether an algorithmic return claim survives realistic testing.
Define “leader” before searching for one
A growth stock is a business-growth hypothesis; a market leader is a relative-performance observation over a chosen window. The two need not coincide. For a reproducible research screen, specify the exchange, security types, minimum trading history and liquidity requirement first. Keep the universe as it was known at each date. A stock that leads a recent ranking is a candidate for investigation, not evidence that it will lead the next period.
Look for growth that survives a filing check
An illustrative screen might ask for expanding sales, improving profitability and enough trading activity to investigate an entry realistically. Write thresholds as your chosen experiment, not universal rules. Check whether EPS changes reflect operations, buybacks, tax effects or a tiny prior-year base. Compare the income statement with cash flow and dilution. A fast-growing headline metric can coexist with weakening cash conversion; use the underlying filing to understand the difference. SEC: Beginners’ Guide to Financial Statements
Combine business evidence with price strength
Choose a benchmark and a fixed price window, then compare the stock and benchmark using the same dates and adjustment basis. Inspect whether strength is broad across the industry or concentrated in one stock, and whether it persists after an earnings event. SEPA-inspired trend screens can organize such observations, but GSDAQ’s list is not Mark Minervini’s complete proprietary process or his personal trading recommendations. His official education and products are separate from GSDAQ. Minervini: official SEPA education and product information
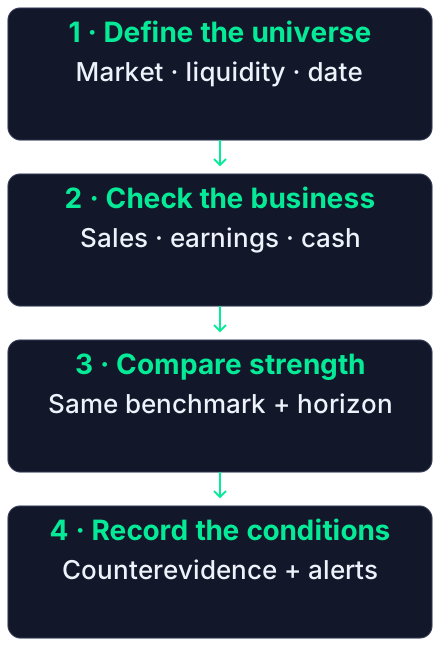
Read the diagram as text
- 1 · Define the universe: Market · liquidity · date
- 2 · Check the business: Sales · earnings · cash
- 3 · Compare strength: Same benchmark + horizon
- 4 · Record the conditions: Counterevidence + alerts
What AI should do in a screening workflow
Use AI to explain why a candidate met the recorded conditions and identify missing evidence. Ask it to distinguish reported results, estimates and price-derived observations. Do not let an explanation silently change your filter thresholds after seeing which stocks performed well. GSDAQ provides strategy-list research and company analysis, not an unrestricted natural-language filter engine across every security. Save the observation date in your own research record so a later refresh does not replace what you originally knew.
An algorithmic trading rule needs an execution experiment
Specify entry, exit, sizing and rebalance timing before calculating a return. If the signal uses the final close, do not also assume a guaranteed fill at that same close. Include spreads, slippage, commissions, financing where used, dividends and corporate actions. Keep separate periods for choosing parameters and evaluating them; preserve failed candidates and delisted securities. A rule-based label in GSDAQ does not execute broker orders. A backtest becomes useful when another reader can reconstruct what information was available and when.
Read return, drawdown and costs together
In an invented two-year example, $100 falling 20% then rising 25% returns to $100. Its cumulative return and CAGR are zero despite a positive 2.5% arithmetic average of the two annual returns. The observed peak-to-trough drawdown is at least 20%; a finer series could reveal a deeper decline. Alongside CAGR, inspect maximum drawdown, exposure, turnover, sample size and the benchmark on identical dates. GSDAQ has no audited, general claim that its AI screener outperforms the market. Historical or hypothetical results should carry their assumptions beside the number.
What momentum research contributes—and what it does not
Jegadeesh and Titman’s 1993 paper reports positive returns for past-winner/past-loser strategies over three-to-twelve-month holding periods. That finding does not validate a current growth stock, a GSDAQ list or the next five-minute candle. It motivates a research question about relative strength; the universe, sample period, costs and testing window still need separate definitions. Jegadeesh & Titman (1993): Returns to Buying Winners and Selling Losers