
What this September 23 close report covers
This report was prepared after the US regular session closed on September 23, 2026 (9:00 p.m. EDT). Equity and sector figures are September 23 regular-session closes; yields are that day's Treasury par yields; business-activity data come from S&P Global's flash release. Oil prices are given with their contract month. Passages labeled GSDAQ's interpretation distinguish our reading of the evidence from reported facts. This dated article does not update automatically and follows this morning's premarket view.
Sources: CNBC · September 23, 2026 stock market live updates and close · Yahoo Finance · September 23 market recap and index quotes · U.S. Treasury · September 2026 daily par yield curve · S&P Global · US Flash PMI, September 2026 · GSDAQ · September 23 premarket view
All three indexes fell; small caps fell most
The Nasdaq fell 1.13% to 26,936.04, ending its record run; its intraday high never reached Tuesday's close. The S&P 500 lost 0.75% and the Dow 0.68%. The Russell 2000 dropped 1.77%, closing essentially at its low, and the semiconductor index (SOX) fell 1.23%. Stocks opened slightly lower and extended losses after the 9:45 a.m. PMI release. The VIX rose 6.83% to 15.18.
Sources: CNBC · September 23, 2026 stock market live updates and close · Yahoo Finance · September 23 market recap and index quotes
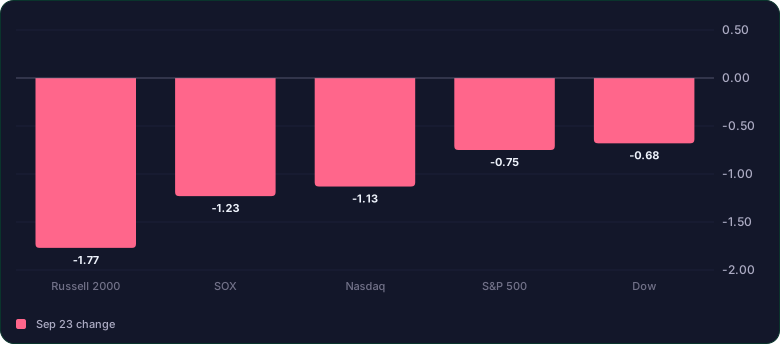
Read the chart as a table
| Sep 23 change (%) | |
|---|---|
| Russell 2000 | -1.77 |
| SOX | -1.23 |
| Nasdaq | -1.13 |
| S&P 500 | -0.75 |
| Dow | -0.68 |
On narrow screens, scroll the table sideways. Keyboard users can focus the table and use the arrow keys.
Four basis points away this morning, 5.11% by the close
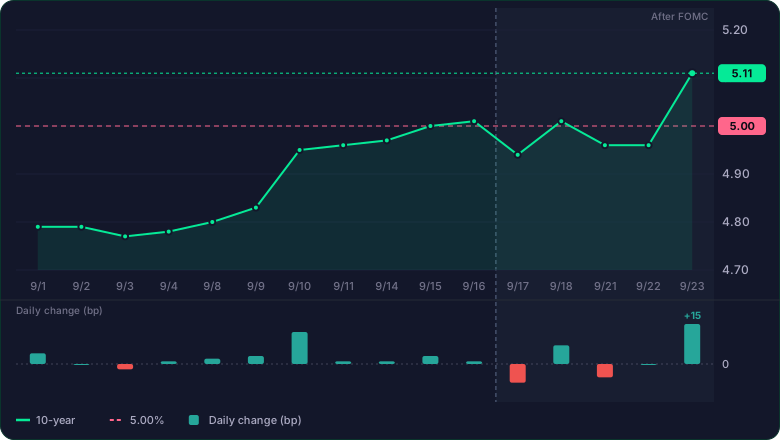
This morning's article noted the ten-year sat four basis points below 5%. The Treasury's September 23 ten-year par yield was 5.11%, up 15 basis points on the day—the largest one-day rise this month. CNBC reported an intraday 5.135%, the highest since July 2007. The two-year rose 14 basis points to 4.85% and the thirty-year 11 basis points to 5.40%. GSDAQ's interpretation: short and long yields rose together. Signs of a hot economy lifted both policy-rate expectations and long-term financing costs.
Sources: U.S. Treasury · September 2026 daily par yield curve · CNBC · September 23, 2026 stock market live updates and close · GSDAQ · September 23 premarket view
Read the chart as a table
| 10-year (%) | Daily change (bp) | |
|---|---|---|
| 9/1 | 4.79 | +4 |
| 9/2 | 4.79 | 0 |
| 9/3 | 4.77 | -2 |
| 9/4 | 4.78 | +1 |
| 9/8 | 4.80 | +2 |
| 9/9 | 4.83 | +3 |
| 9/10 | 4.95 | +12 |
| 9/11 | 4.96 | +1 |
| 9/14 | 4.97 | +1 |
| 9/15 | 5.00 | +3 |
| 9/16 | 5.01 | +1 |
| 9/17 | 4.94 | -7 |
| 9/18 | 5.01 | +7 |
| 9/21 | 4.96 | -5 |
| 9/22 | 4.96 | 0 |
| 9/23 | 5.11 | +15 |
On narrow screens, scroll the table sideways. Keyboard users can focus the table and use the arrow keys.
A hot economy, and a Fed open to tightening further
S&P Global's flash US composite PMI for September rose to 58.4, a 62-month high. Services reached 58.7 and manufacturing 57.0, both well above August. The release said input-cost inflation was the strongest since October 2022, led by energy. The same day, Fed Governor Barr said further policy adjustments are likely to be needed. CME FedWatch odds of an October hike, as cited by CNBC, rose above 66%. GSDAQ's interpretation: a textbook day of good data weighing on stocks. Prices and rates were read before growth.
Sources: S&P Global · US Flash PMI, September 2026 · CNBC · September 23, 2026 stock market live updates and close
On narrow screens, scroll the table sideways. Keyboard users can focus the table and use the arrow keys.
One sector of eleven rose: energy
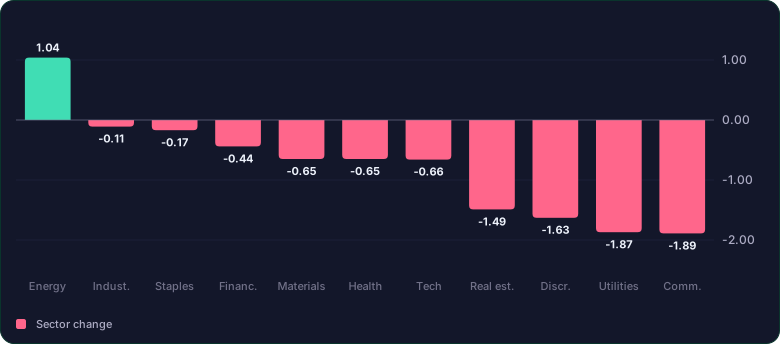
Of the S&P 500's eleven sector indexes, only energy rose, up 1.04%. Communication services (−1.89%), utilities (−1.87%), consumer discretionary (−1.63%) and real estate (−1.49%) fell most. Industrials (−0.11%) and consumer staples (−0.17%) held up best. GSDAQ's interpretation: rate-sensitive utilities and real estate fell alongside growth stocks whose value rests on distant earnings, while only the sector tied to oil's rebound held. This looks less like a tech-only pullback than a day when yields repriced the market.
Read the chart as a table
| Sector change (%) | |
|---|---|
| Energy | 1.04 |
| Indust. | -0.11 |
| Staples | -0.17 |
| Financ. | -0.44 |
| Materials | -0.65 |
| Health | -0.65 |
| Tech | -0.66 |
| Real est. | -1.49 |
| Discr. | -1.63 |
| Utilities | -1.87 |
| Comm. | -1.89 |
Alphabet −3.80%, Meta +1.02%
Large AI stocks split. Alphabet fell 3.80% to $337.83; Yahoo Finance pointed to competition from Meta's AI assistant, price cuts on leading AI models and heavy capital spending. Meta rose 1.02% to $744.10, Nvidia fell 1.47% to $225.51 and Microsoft gained 0.52%. McDonald's fell 4.81% after its investor day warned that inflation and flat traffic would persist. GSDAQ's interpretation: within the same AI theme, competitive position and cost burdens drive stocks apart.
Sources: Yahoo Finance · Why Alphabet (GOOGL) stock is down today · Yahoo Finance · September 23 market recap and index quotes · CNBC · September 23, 2026 stock market live updates and close
On narrow screens, scroll the table sideways. Keyboard users can focus the table and use the arrow keys.
$98 this morning, $103 by the settle: oil reversed
This morning's article had Brent in the $98 range on hopes for US–Iran talks. By the close the direction had flipped. The near-expiry November Brent contract settled about 3.9% higher at $103.08, and November WTI rose 1.8% to $92.16. CNBC attributed the rebound to the strong PMI. December Brent settled at $98.12, so the contract month matters. GSDAQ's interpretation: oil's rebound points the same way as the input-cost pressure in the PMI. Rising yields and oil together can renew pressure on corporate costs.
Sources: CNBC · September 23, 2026 stock market live updates and close · GSDAQ · September 23 premarket view
What to check on Thursday and Friday
Thursday brings weekly jobless claims and August new home sales, with Costco reporting after the close and several Fed officials, including New York Fed President Williams, speaking. Friday brings August durable goods orders and the final University of Michigan sentiment reading. GSDAQ's interpretation: watch whether the ten-year holds above 5%, whether October hike expectations grow, and whether AI-related results keep adding evidence despite higher rates. This article does not forecast direction; it lists the numbers to check.
Sources: Kiplinger · This week's economic calendar · CNBC · September 23, 2026 stock market live updates and close
Sources
- CNBC · September 23, 2026 stock market live updates and close
- Yahoo Finance · September 23 market recap and index quotes
- U.S. Treasury · September 2026 daily par yield curve
- S&P Global · US Flash PMI, September 2026
- Yahoo Finance · S&P 500 sector index quotes, September 23 close (Energy ^GSPE shown; other sectors ^SP500-15 to ^SP500-60)
- Yahoo Finance · Why Alphabet (GOOGL) stock is down today
- GSDAQ · September 23 premarket view
- Kiplinger · This week's economic calendar