
The October 5 setup
The biggest event for US stocks on Monday, October 5, comes 15 and 30 minutes after the open: two services PMIs. S&P Global's US Services PMI is due at 9:45 a.m. ET and the ISM Services PMI at 10:00 a.m. ET. This brief reflects information as of 4:00 a.m. PDT (7:00 a.m. EDT) on October 5, before either September reading was out, so it sets out what to compare and what to record. Two scenes framed the morning. Friday's jobs report showed September payrolls up only 29,000, yet all three major indexes rose that day, and the 10-year Treasury yield dipped right after the release before climbing back to end above the prior day's level. Then, at 6:20 a.m. ET on Monday, Reuters reported the three index futures down about 0.2%. Friday's cash closes and Monday's futures are different instruments, so these two scenes alone don't set the direction for the regular session.
Sources: Reuters on futures (via StreetInsider) · Reuters on Friday's markets (via MarketScreener)
Monday morning readings
Reuters said futures slipped as tech stocks took a breather. The changes in the table are as reported by Reuters, and futures are not the same as the cash indexes in the Friday table below. Nasdaq-100 futures also track a different index from the Nasdaq Composite. The 5.28% 10-year yield is the last value cited in the article and is not guaranteed to be a quote from the same moment as the futures.
Sources: Reuters on futures (via StreetInsider)
On narrow screens, scroll the table sideways. Keyboard users can focus the table and use the arrow keys.
| Item | Reported change | Observed |
|---|---|---|
| S&P 500 E-mini futures Source | -14.25 pts / -0.18% | Oct 5, 6:20 a.m. ET |
| Nasdaq-100 E-mini futures Source | -78.25 pts / -0.25% | Oct 5, 6:20 a.m. ET |
| Dow E-mini futures Source | -101 pts / -0.20% | Oct 5, 6:20 a.m. ET |
| US 10-year Treasury yield Source | 5.28% | Last value in a 6:46 a.m. ET article |
Friday's baseline
Friday's index figures are regular-session closes, and the yield is the last value reported in the article. Yields fell right after the jobs release but climbed again during the day, so both stocks and yields ended higher than the day before. Monday morning's 5.28% is effectively the same level as Friday's reading. Because the two values come from different articles at different times, this brief does not compare them to the decimal. From the jobs report, the numbers to keep in view are September nonfarm payrolls of +29,000 (seasonally adjusted, preliminary), an unemployment rate of 4.2% (4.1% in August) and a combined downward revision of 60,000 to July and August. These figures alone don't establish a recession or the Fed's next decision.
Sources: Reuters on Friday's markets (via MarketScreener) · BLS Employment Situation, September 2026
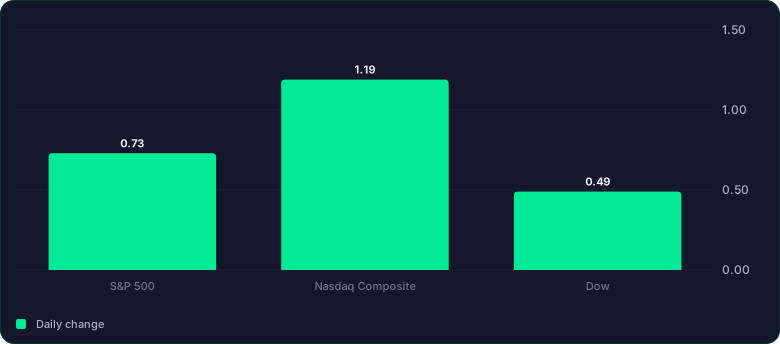
Read the chart as a table
| Daily change (%) | |
|---|---|
| S&P 500 | 0.73 |
| Nasdaq Composite | 1.19 |
| Dow | 0.49 |
On narrow screens, scroll the table sideways. Keyboard users can focus the table and use the arrow keys.
| Item | Level | Change | Basis |
|---|---|---|---|
| S&P 500 Source | 7,722.72 | +56.27 pts / +0.73% | Oct 2 regular-session close |
| Nasdaq Composite Source | 27,190.86 | +319.27 pts / +1.19% | Oct 2 regular-session close |
| Dow Jones Industrial Average Source | 51,176.96 | +250.40 pts / +0.49% | Oct 2 regular-session close |
| US 10-year Treasury yield Source | 5.28% | +4.72 bp | Last value in an Oct 2 Reuters article |
Today's schedule
On the NYSE calendar, October 5 is neither a holiday nor an early close. The 10:00 a.m. ET ISM time comes from the next-release note at the bottom of the August report and from ISM's report calendar. The 9:45 a.m. ET S&P Global time is from Kiplinger's weekly economic calendar.
Sources: NYSE trading hours and calendars · ISM report calendar · Kiplinger weekly economic calendar
On narrow screens, scroll the table sideways. Keyboard users can focus the table and use the arrow keys.
August ISM details as the September yardstick
August's headline PMI was 55.4. The values below are August actuals, not September forecasts. For the headline, New Orders and Employment, 50 separates expansion from contraction; for Prices, 50 separates rising from falling prices. A Prices reading of 72.6 does not mean prices rose 72.6%, nor that 72.6% of firms reported higher prices. The ISM Employment index is a survey measure, not the same thing as Friday's BLS payroll count, and weak employment does not automatically mean easing price pressure. S&P Global's 9:45 a.m. ET figure comes from a different survey. Compare it with that survey's own prior reading, not with ISM's 55.4.
Sources: ISM Services PMI report, August 2026
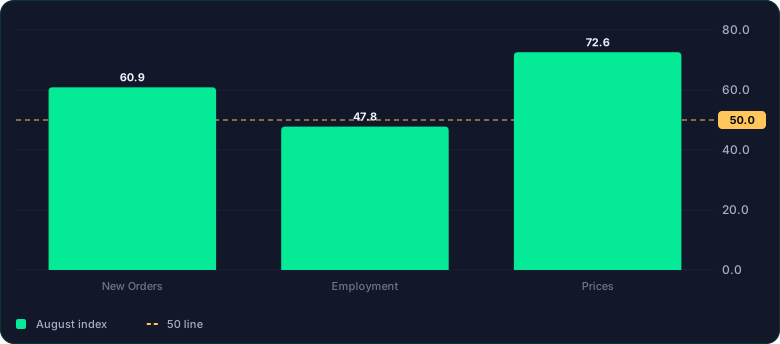
Read the chart as a table
| August index (pt) | |
|---|---|
| New Orders | 60.9 |
| Employment | 47.8 |
| Prices | 72.6 |
On narrow screens, scroll the table sideways. Keyboard users can focus the table and use the arrow keys.
| Item | August reading | What 50 means | What to check in September |
|---|---|---|---|
| New Orders Source | 60.9 | Above 50 expansion, below contraction | Whether it stayed above 50, and whether it rose or fell from August |
| Employment Source | 47.8 | Above 50 expansion, below contraction | Whether it moved toward or above 50 |
| Prices Source | 72.6 | Above 50 rising prices, below falling | Whether it fell from August or stayed high |
Questions for the afternoon
1) Which way did ISM New Orders move from August's 60.9, and how far was it from 50? 2) Did Employment move toward or above 50 from August's 47.8? Did Prices fall below August's 72.6, pointing to easier price pressure? Separate whether both changed or only one, and whether that mix fits Friday's jobs picture. 3) Comparing like with like, futures with futures and cash with cash, did stocks and the 10-year yield rise together as they did on Friday? Record the moves in the 15 to 30 minutes around 10:00 a.m. ET and how they differed from the regular-session close. GSDAQ's October 5 market-close brief, published in Korean and Japanese, compares these questions with the September releases. This brief summarizes public information for educational purposes. It is not a recommendation to buy or sell any security and is not investment advice.