
The September 30 cutoff
This article uses information checked through 12:45 p.m. EDT on September 30, 2026. Stock indexes use September 29 regular-session closes. Treasury yields are the Treasury’s official daily par yields for September 29, derived from indicative quotes around 3:30 p.m. Mortgage rates come from two surveys that measure different things, so both are shown. Housing figures are the latest monthly releases, which cover July or August. Figures marked as GSDAQ calculations are arithmetic on those published numbers. This is a dated personal market view, not investment advice, and it does not update automatically.
Sources: U.S. Treasury · Daily par yield curve, September 2026 · Freddie Mac · Primary Mortgage Market Survey · Mortgage News Daily · 30-year fixed daily index
Borrowing costs more. Prices are higher anyway.
The 10-year Treasury par yield closed September 29 at 5.26%. That equals the June 12, 2007 reading and is the highest since then; the October 2023 peak was 4.98%. A year earlier it was 4.15%. Mortgage News Daily’s daily index put the average 30-year fixed rate at 7.58%, after it reached 7.50% on September 28 for the first time since April 30, 2024. Freddie Mac’s weekly survey, which covers conforming purchase loans with 20% down and excellent credit, averaged 7.03% on September 24. Over the same stretch the S&P 500 closed at 7,670.84, up 12.1% this year and 1.6% below its August 13 record close, and the Case-Shiller national home price index rose 1.9% from a year earlier in July.
Sources: U.S. Treasury · Daily par yield curve, September 2026 · Mortgage News Daily · 30-year fixed daily index · Freddie Mac · Primary Mortgage Market Survey · Yahoo Finance · S&P 500 historical prices · S&P Dow Jones Indices · Case-Shiller index, July 2026 (September 29)
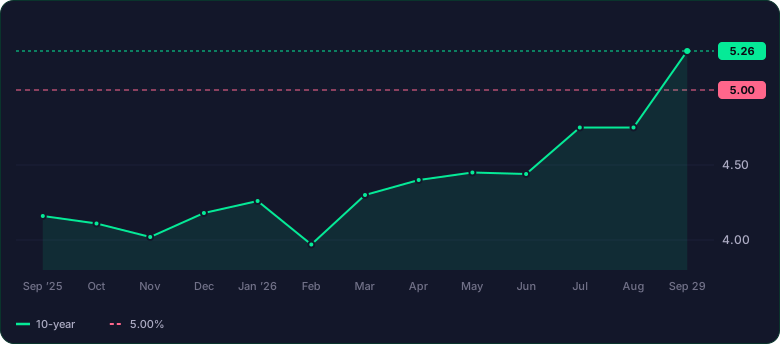
Read the chart as a table
| 10-year (%) | |
|---|---|
| Sep ’25 | 4.16 |
| Oct | 4.11 |
| Nov | 4.02 |
| Dec | 4.18 |
| Jan ’26 | 4.26 |
| Feb | 3.97 |
| Mar | 4.30 |
| Apr | 4.40 |
| May | 4.45 |
| Jun | 4.44 |
| Jul | 4.75 |
| Aug | 4.75 |
| Sep 29 | 5.26 |
On narrow screens, scroll the table sideways. Keyboard users can focus the table and use the arrow keys.
| Measure | Latest | Context | As of |
|---|---|---|---|
| 10-year Treasury yield Source | 5.26% | 4.15% a year earlier (+111bp) | Sep 29 |
| 30-year fixed mortgage · daily index Source | 7.58% | 6.38% a year earlier | Sep 29 |
| S&P 500 Source | +12.1% | Year to date · close 7,670.84 | Sep 29 |
| U.S. home prices · Case-Shiller national Source | +1.9% | Year over year · +1.6% in June | July |
| 30-year fixed mortgage · Freddie Mac weekly Source | 7.03% | 6.30% a year earlier | Sep 24 |
Why are stocks still rising?
Because expected profits rose faster than higher rates pushed valuations down. FactSet’s September 25 report estimates third-quarter S&P 500 earnings growth of 29.1%, which would be a third straight quarter above 25%. Since June 30 the forward 12-month earnings estimate rose 8.9% while the index rose 2.7%. The forward price-to-earnings ratio fell from 20.4 to 19.2, below its five-year average of 19.8. Over the same period the 10-year yield rose 82 basis points, from 4.44% to 5.26%. GSDAQ’s reading: higher rates did lower what investors pay for each dollar of earnings. Earnings grew by more. A forward P/E of 19.2 is an earnings yield of about 5.2% (GSDAQ calculation), roughly equal to the 10-year yield, so stocks are now held for growth in earnings and no longer for a yield advantage over Treasuries.
Sources: FactSet · Earnings Insight, September 25, 2026 · U.S. Treasury · Daily par yield curve, September 2026
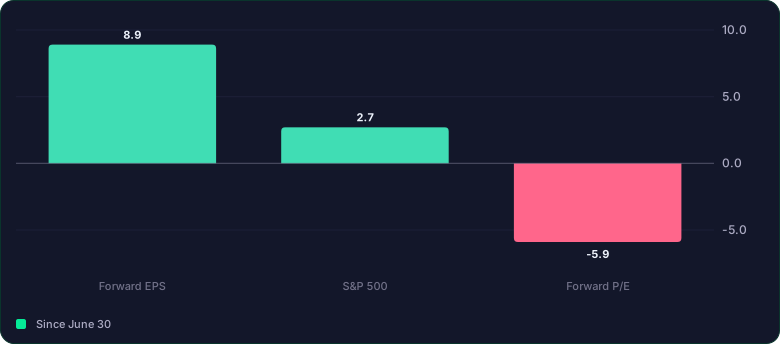
Read the chart as a table
| Since June 30 (%) | |
|---|---|
| Forward EPS | 8.9 |
| S&P 500 | 2.7 |
| Forward P/E | -5.9 |
On narrow screens, scroll the table sideways. Keyboard users can focus the table and use the arrow keys.
Where do higher rates show up first?
Outside the headline index, in companies and sectors that depend on borrowing. From August 31 to September 29 the 10-year yield rose 51 basis points. The Nasdaq Composite gained 1.6% and the S&P 500 slipped 0.2%. The equal-weight S&P 500 ETF (RSP) fell 4.1%, the Russell 2000 fell 5.0% and the iShares U.S. Home Construction ETF (ITB) fell 5.9%; both ETFs are measured on dividend-adjusted closes. GSDAQ’s reading: the S&P 500 is weighted by market value, so the largest companies with fast-growing earnings hold the index up. The average stock, smaller companies and homebuilders already fell this month. “Stocks are rising” describes the index better than it describes the typical stock.
Sources: Yahoo Finance · Nasdaq Composite historical prices · Yahoo Finance · S&P 500 historical prices · Yahoo Finance · Invesco S&P 500 Equal Weight ETF (RSP) historical prices · Yahoo Finance · Russell 2000 historical prices · Yahoo Finance · iShares U.S. Home Construction ETF (ITB) historical prices · U.S. Treasury · Daily par yield curve, September 2026
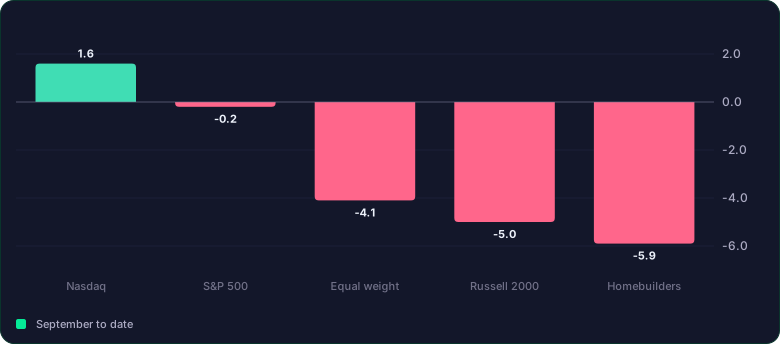
Read the chart as a table
| September to date (%) | |
|---|---|
| Nasdaq | 1.6 |
| S&P 500 | -0.2 |
| Equal weight | -4.1 |
| Russell 2000 | -5.0 |
| Homebuilders | -5.9 |
On narrow screens, scroll the table sideways. Keyboard users can focus the table and use the arrow keys.
| Index or fund | Aug 31 | Sep 29 | Change |
|---|---|---|---|
| Nasdaq Composite Source | 26,370.89 | 26,797.54 | +1.6% |
| S&P 500 Source | 7,686.14 | 7,670.84 | −0.2% |
| S&P 500 equal weight ETF (RSP) Source | 218.57 | 209.50 | −4.1% |
| Russell 2000 Source | 2,956.45 | 2,807.92 | −5.0% |
| Home construction ETF (ITB) Source | 93.90 | 88.38 | −5.9% |
Are home prices really rising?
In nominal terms yes, and after inflation no. The Case-Shiller national index rose 1.9% from a year earlier in July, up from 1.6% in June. S&P Dow Jones Indices noted that inflation ran at 3.4%, so home values fell in real terms for a 14th straight month. FHFA’s index rose 2.6%. The median existing-home price was $429,100 in August, up 1.6% and the 38th consecutive annual gain. New homes moved the other way: the median new-home price was $393,700, 5.8% below a year earlier, although the Census Bureau puts the margin of error on that change at ±8.2%. Prices also differ by city. Chicago rose 6.9% and New York 5.8%, while Seattle, Las Vegas and Denver declined.
Sources: S&P Dow Jones Indices · Case-Shiller index, July 2026 (September 29) · FHFA · House Price Index, July 2026 (September 29) · National Association of Realtors · Existing-home sales, August 2026 · U.S. Census Bureau · New residential sales, August 2026
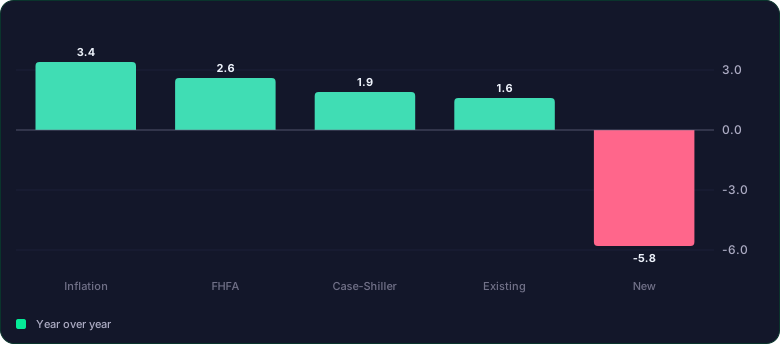
Read the chart as a table
| Year over year (%) | |
|---|---|
| Inflation | 3.4 |
| FHFA | 2.6 |
| Case-Shiller | 1.9 |
| Existing | 1.6 |
| New | -5.8 |
On narrow screens, scroll the table sideways. Keyboard users can focus the table and use the arrow keys.
| Measure | Year over year | Month |
|---|---|---|
| Inflation cited in the Case-Shiller release Source | +3.4% | July |
| FHFA House Price Index Source | +2.6% | July |
| Case-Shiller national index Source | +1.9% | July |
| Median existing-home price ($429,100) Source | +1.6% | August |
| Median new-home price ($393,700) Source | −5.8% | August |
Why haven’t 7.5% mortgages pushed prices down?
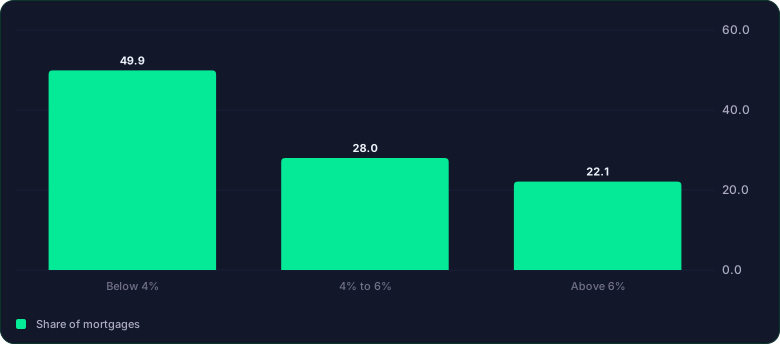
Because the new rate applies only to people who borrow now. In FHFA’s National Mortgage Database for the first quarter of 2026, 49.9% of outstanding mortgages carried a rate below 4% and 22.1% were above 6%. An owner with a 4% loan has little reason to sell and borrow again at 7.5%, so fewer homes come to market. Existing-home sales ran at a 3.98 million annual rate in August, 1.2% below a year earlier, and 27% of purchases were all cash. For a buyer who does need a loan, the cost has moved: on the median existing home with 20% down, the monthly principal and interest payment is about $2,419 at 7.58%, against $2,143 at last year’s 6.38% (GSDAQ calculation). GSDAQ’s reading: rates are working through the number of sales and listings before they reach the price. Inventory rose to 1.62 million homes, a 4.9-month supply that NAR’s chief economist called the highest in more than 10 years.
Sources: Calculated Risk · FHFA National Mortgage Database, Q1 2026 · National Association of Realtors · Existing-home sales, August 2026 · Mortgage News Daily · 30-year fixed daily index · Freddie Mac · Primary Mortgage Market Survey
Read the chart as a table
| Share of mortgages (%) | |
|---|---|
| Below 4% | 49.9 |
| 4% to 6% | 28.0 |
| Above 6% | 22.1 |
On narrow screens, scroll the table sideways. Keyboard users can focus the table and use the arrow keys.
| Rate | Basis | Monthly payment |
|---|---|---|
| 6.38% Source | Mortgage News Daily index · a year earlier | $2,143 |
| 7.58% Source | Mortgage News Daily index · Sep 29 | $2,419 |
| 6.30% Source | Freddie Mac weekly survey · a year earlier | $2,125 |
| 7.03% Source | Freddie Mac weekly survey · Sep 24 | $2,291 |
The author’s view
A 10-year yield near 5.3% looks like a breaking point. But when I think back to the dot-com bubble, I think we have entered a phase where rates can no longer hold asset prices down. Rates rose then, too. The Fed raised its target six times between June 30, 1999 and May 16, 2000, from 4.75% to 6.50%, and the 10-year yield reached 6.79% on January 20, 2000. Over the same stretch the Nasdaq gained 85.6% in 1999 and set a record close of 5,048.62 on March 10, 2000. Today’s 5.26% 10-year yield and 3.75%–4.00% policy rate are both lower than they were then.
Sources: Federal Reserve · Historical changes of the target federal funds rate · U.S. Treasury · Daily par yield curve, 2000 · Yahoo Finance · Nasdaq Composite historical prices, 1998–2002
On narrow screens, scroll the table sideways. Keyboard users can focus the table and use the arrow keys.
| Measure | 1999–2000 | 2026 |
|---|---|---|
| Fed target rate Source | 4.75% → 6.50% · six hikes | 3.50%–3.75% → 3.75%–4.00% · Sep 16 |
| 10-year Treasury yield Source | Peak 6.79% · Jan 20, 2000 | 5.26% · Sep 29 |
| Nasdaq Composite Source | +85.6% in 1999 · record close 5,048.62 on Mar 10, 2000 | +15.3% year to date · Sep 29 |
What would change this picture?
Three things, each with a date to check. This week: Freddie Mac’s next weekly survey on October 1 shows whether its average follows the daily index toward 7.5%. In October: third-quarter earnings reports test the 29.1% growth estimate, and the Federal Reserve meets October 27–28 after raising its target range to 3.75%–4.00% on September 16. August PCE inflation, published September 30, was 3.4% from a year earlier and 3.0% excluding food and energy. Over the following months: watch whether housing supply keeps rising from 4.9 months and whether the 38-month run of annual gains in the median existing-home price ends. In the 1999–2000 period the author compares, the Nasdaq also rose while rates climbed, then fell 77.9% from its March 10, 2000 peak to 1,114.11 on October 9, 2002. GSDAQ’s reading: the index holds while earnings estimates rise faster than yields. If estimates stop rising with the 10-year still above 5%, valuations have less room to absorb it. For housing, the signal would be more owners who have to sell, and that shows up in inventory before it shows up in price. These are observation criteria, not trading signals.
Sources: Freddie Mac · Primary Mortgage Market Survey · FactSet · Earnings Insight, September 25, 2026 · Federal Reserve · FOMC statement, September 16, 2026 · Bureau of Economic Analysis · Personal income and outlays, August 2026 · National Association of Realtors · Existing-home sales, August 2026 · Yahoo Finance · Nasdaq Composite historical prices, 1998–2002
Common questions
Short answers to four questions this topic raises, each based on the figures above.
On narrow screens, scroll the table sideways. Keyboard users can focus the table and use the arrow keys.
| Question | Answer |
|---|---|
| Why do some reports say 7.5% when Freddie Mac says 7.03%? Source | They are different surveys. Mortgage News Daily’s index is daily and stood at 7.58% on September 29. Freddie Mac publishes a weekly average for conforming purchase loans with 20% down and excellent credit; it was 7.03% on September 24. |
| How high is a 5.26% 10-year yield? Source | It matches the Treasury’s June 12, 2007 par yield and is the highest since then. The October 2023 peak was 4.98%. |
| How can stocks rise while valuations fall? Source | Price is earnings multiplied by the valuation multiple. Since June 30 forward earnings estimates rose 8.9% and the forward P/E fell from 20.4 to 19.2, which left the index up 2.7%. |
| Home prices are up, so why call it a real decline? Source | The national index rose 1.9% while inflation was 3.4%. A price that rises more slowly than inflation buys less than it did a year earlier. |
Sources
- U.S. Treasury · Daily par yield curve, September 2026
- Freddie Mac · Primary Mortgage Market Survey
- Mortgage News Daily · 30-year fixed daily index
- FactSet · Earnings Insight, September 25, 2026
- Yahoo Finance · S&P 500 historical prices
- Yahoo Finance · Nasdaq Composite historical prices
- Yahoo Finance · Russell 2000 historical prices
- Yahoo Finance · Invesco S&P 500 Equal Weight ETF (RSP) historical prices
- Yahoo Finance · iShares U.S. Home Construction ETF (ITB) historical prices
- S&P Dow Jones Indices · Case-Shiller index, July 2026 (September 29)
- FHFA · House Price Index, July 2026 (September 29)
- National Association of Realtors · Existing-home sales, August 2026
- U.S. Census Bureau · New residential sales, August 2026
- Calculated Risk · FHFA National Mortgage Database, Q1 2026
- Federal Reserve · FOMC statement, September 16, 2026
- Bureau of Economic Analysis · Personal income and outlays, August 2026
- GSDAQ · September 14: the 10-year at 5%
- Federal Reserve · Historical changes of the target federal funds rate
- U.S. Treasury · Daily par yield curve, 2000
- Yahoo Finance · Nasdaq Composite historical prices, 1998–2002