
The October 6 setup
This brief reflects information as of 4:00 a.m. PDT (7:00 a.m. EDT) on October 6. The August goods and services trade balance had not been released yet; it was due at 8:30 a.m. EDT that day. The trade deficit is imports minus exports. A narrower deficit can come from higher exports or from lower imports. So the release should be read for the size of the deficit and, separately, for which way exports and imports each moved from the prior month.
Sources: BEA release schedule
Monday's close and overnight reports
All three major indexes rose in the October 5 regular session, and the Nasdaq Composite set a record close. Overnight, Reuters reported S&P 500 futures up about 0.2% and the US 10-year Treasury yield down 3 basis points at about 5.28%. Those values come from an article updated at 5:34 a.m. EDT on October 6. The update time is not when the prices were observed, and the article did not give the futures contract month or quote times. So these are not live values as of 4:00 a.m. PDT, nor official closes. The report alone also does not explain why yields fell or whether the move would last.
Sources: Reuters October 5 market close (via MarketScreener) · Reuters October 6 markets report (via MarketScreener)
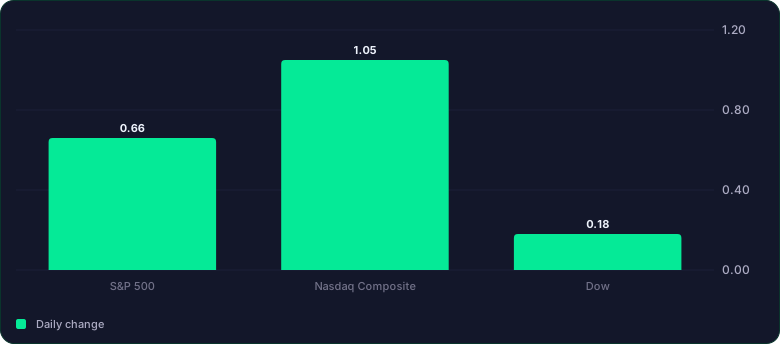
Read the chart as a table
| Daily change (%) | |
|---|---|
| S&P 500 | 0.66 |
| Nasdaq Composite | 1.05 |
| Dow | 0.18 |
On narrow screens, scroll the table sideways. Keyboard users can focus the table and use the arrow keys.
July values as the baseline
The numbers below are not the ones due today. They are July figures released on September 3, all seasonally adjusted in nominal dollars. In July, exports fell $6.6 billion from June and imports rose $10.8 billion. Both moves pushed the same way and widened the deficit by $17.4 billion. The deficit figure alone cannot separate the export decline from the import increase. Today's August report may revise July. If it does, the post-release comparison uses the revised figures.
Sources: BEA and Census, US trade in goods and services, July 2026
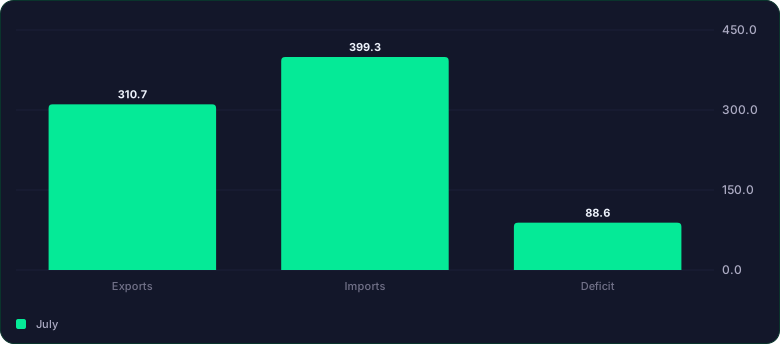
Read the chart as a table
| July ($bn) | |
|---|---|
| Exports | 310.7 |
| Imports | 399.3 |
| Deficit | 88.6 |
On narrow screens, scroll the table sideways. Keyboard users can focus the table and use the arrow keys.
Three things to check after the release
1) Check whether exports rose from revised July. Whether exports recovered shows up in the monthly change in exports, not in the size of the deficit. 2) Check which way imports moved and how much they contributed to the deficit. Even if lower imports narrowed the deficit, that does not by itself mean weak domestic demand; the product mix and prices need a closer look. In July, imports of capital goods, which include computers and peripherals, rose $14.4 billion. That figure is from Census goods data and covers a different scope from total goods and services imports. 3) Check whether the deficit widened or narrowed from the revised prior month, then use the first two items to separate the reasons. These are nominal dollars, not adjusted for prices. Real GDP strips out price changes, so the nominal trade balance alone cannot settle the GDP contribution or the direction of the economy.
Sources: BEA and Census, US trade in goods and services, July 2026
Today's schedule
Vice Chair for Supervision Bowman's speech was about modernizing regulation and supervision. It was not a rate-setting event, and its content was not yet known. The regular session ran 9:30 a.m. to 4:00 p.m. EDT with no early close. The table lists only three confirmed events and is not a full calendar for the day.
Sources: BEA release schedule · NYSE trading hours and calendars · Federal Reserve October calendar
On narrow screens, scroll the table sideways. Keyboard users can focus the table and use the arrow keys.
Conditions for the market-close review
The closing brief checks the export and import split above against the actual August figures. The overnight Reuters values report the direction of yields and futures and are not used as pre-release reference quotes. Market reactions just before and after the release are assessed only with newly obtained data: for yields, the same 10-year maturity before and after; for futures, S&P 500 futures with a confirmed contract month and observation times, using the same contract before and after. The brief does not compute precise differences from the overnight article values, and it does not compare the prior day's cash close directly with futures moves. Without that data, the reaction around the release is recorded as unverified. Even if yields and futures moved together after the release, that would not show the trade data moved them. These conditions are observation criteria, not trading recommendations or return forecasts. The comparison with the actual August data is in the market-close brief for the same day.