
The October 6 close in brief
The US trade deficit widened in August because imports grew more than exports. Exports also rose from July, but the increase in imports was larger. The same day, the S&P 500 and Nasdaq Composite closed at record highs. There is no confirmed link between the stock gains and the trade data. This brief reflects information as of 4:00 p.m. PDT (7:00 p.m. EDT) on October 6. The regular session ended at 4:00 p.m. EDT (1:00 p.m. PDT), and it was not an early close. The closes below are regular-session values and exclude after-hours trading.
Sources: NYSE trading hours and calendars
Indexes: Record closes for the S&P 500 and Nasdaq
The closes are the values on which AP's and MT Newswires' closing reports agree. Percentage changes are calculated against the prior close. The Nasdaq Composite set a second straight record close; it is a different index from the Nasdaq-100. According to Reuters' closing report, 10 of the 11 S&P 500 sectors rose, all except health care, with utilities gaining the most. Reuters pointed to anticipation ahead of corporate earnings.
Sources: AP market close report · MT Newswires market close (via Yahoo Finance) · Reuters market close (via MarketScreener)
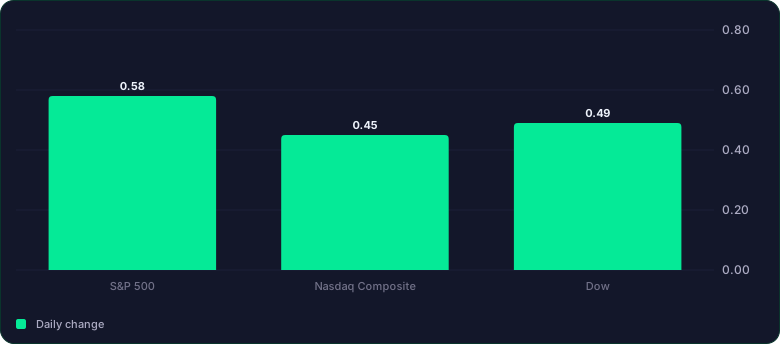
Read the chart as a table
| Daily change (%) | |
|---|---|
| S&P 500 | 0.58 |
| Nasdaq Composite | 0.45 |
| Dow | 0.49 |
On narrow screens, scroll the table sideways. Keyboard users can focus the table and use the arrow keys.
Trade: The morning's plan and the result
The morning brief planned to split the change in the trade deficit into exports and imports. Its baseline then was July's $88.6 billion deficit, as released on September 3. Today's report revised July's deficit to $92.8 billion, mostly because July imports were revised up. So August's change is read against revised July. The gap between $88.6 billion and August's deficit is not this month's increase. Figures are seasonally adjusted, in nominal dollars, goods and services combined, on a balance-of-payments basis. Amounts and changes are BEA's rounded values, so details may not sum to totals.
Sources: BEA and Census, US trade in goods and services, August 2026 · BEA data table (Exhibit 1)
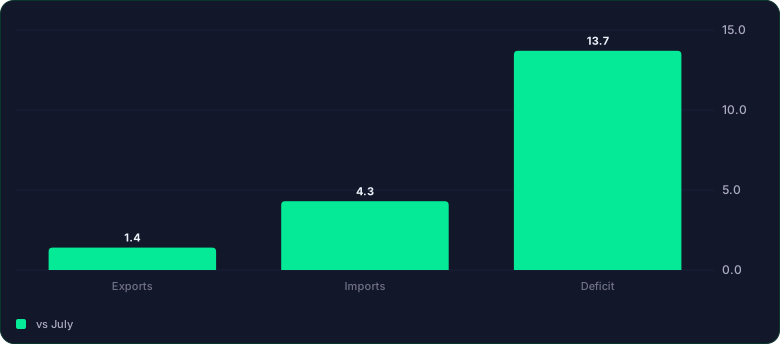
Read the chart as a table
| vs July (%) | |
|---|---|
| Exports | 1.4 |
| Imports | 4.3 |
| Deficit | 13.7 |
On narrow screens, scroll the table sideways. Keyboard users can focus the table and use the arrow keys.
Why the deficit grew while exports rose
The answer to the morning's questions: exports rose from the prior month. Imports did not fall; they rose, by nearly four times the increase in exports. When imports grow more than exports, the gap between them, the deficit, widens. That is how higher exports and a wider deficit showed up in the same month. By Census product category, the import increase came largely from industrial supplies and materials, up $9.1 billion, including $3.3 billion in crude oil and $3.1 billion in nonmonetary gold. Capital goods imports rose $6.2 billion. These are nominal amounts, so they alone cannot establish real growth or a broad economic recovery.
Sources: BEA and Census, US trade in goods and services, August 2026
Yields and the reaction to the release
AP reported the 10-year Treasury yield at 5.28%, down from 5.31% late the previous day. That is an observation cited in the article, not an official close. The morning brief planned to compare the minutes just before and after the 8:30 a.m. EDT release using the same futures contract and the same yield maturity. That data was not obtained, so the immediate reaction is unverified. The day's direction, lower yields and higher stocks, is not used to judge the effect of the trade data.
Sources: AP market close report
Next on the calendar
The Fed was scheduled to release the minutes of the September 15–16 FOMC meeting at 2:00 p.m. EDT (11:00 a.m. PDT) on October 7. They are a record of the last meeting, not a new rate decision, and their content was not yet known. On October 6, Vice Chair for Supervision Michelle Bowman released a speech on modernizing the regulation and supervision of regional banks to fit their size and risk. This brief summarizes public information for educational purposes. It is not a recommendation to buy or sell any security and is not investment advice.
Sources: Federal Reserve October calendar · Speech by Vice Chair for Supervision Bowman (October 6)
Sources
- NYSE trading hours and calendars
- AP market close report
- MT Newswires market close (via Yahoo Finance)
- Reuters market close (via MarketScreener)
- BEA and Census, US trade in goods and services, August 2026
- BEA data table (Exhibit 1)
- Federal Reserve October calendar
- Speech by Vice Chair for Supervision Bowman (October 6)